A/B/n Experiments with Rewards
This tutorial describes how to use Iter8 to evaluate two or more versions on an application or ML model to identify the "best" version according to some reward metric(s).
A reward metric is a metric that measures the benefit or profit of a version of an application or ML model. Reward metrics are usually application or model specific. User engagement, sales, and net profit are examples.
Assumptions
We assume that you have deployed multiple versions of an application (or ML model) with the following characteristics:
- There is a way to route user traffic to the deployed versions. This might be done using the Iter8 SDK, the Iter8 traffic control features, or some other mechanism.
- Metrics, including reward metrics, are being exported to a metrics store such as Prometheus.
- Metrics can be retrieved from the metrics store by application (model) version.
In this tutorial, we mock a Prometheus service and demonstrate how to write an Iter8 experiment that evaluates reward metrics.
Mock Prometheus
For simplicity, we use mockoon to create a mocked Prometheus service instead of deploying Prometheus itself:
kubectl create deploy prometheus-mock \
--image mockoon/cli:latest \
--port 9090 \
-- mockoon-cli start --daemon-off \
--port 9090 \
--data https://raw.githubusercontent.com/iter8-tools/docs/v0.14.6/samples/abn/model-prometheus-abn-tutorial.json
kubectl expose deploy prometheus-mock --port 9090
Define template
Create a provider specification that describes how Iter8 should fetch each metric value from the metrics store. The specification provides information about the provider URL, the HTTP method to be used, and any common headers. Furthermore, for each metric, there is: - metadata, such as name, type and description, - HTTP query parameters, and - a jq expression describing how to extract the metric value from the response.
For example, a specification for the mean latency metric from Prometheus can look like the following:
metric:
- name: latency-mean
  type: gauge
  description: |
    Mean latency
  params:
  - name: query
    value: |
      (sum(last_over_time(revision_app_request_latencies_sum{
        {{- template "labels" . }}
      }[{{ .elapsedTimeSeconds }}s])) or on() vector(0))/(sum(last_over_time(revision_app_request_latencies_count{
        {{- template "labels" . }}
      }[{{ .elapsedTimeSeconds }}s])) or on() vector(0))
  jqExpression: .data.result[0].value[1] | tonumber
Note that the template is parameterized. Values are provided by the Iter8 experiment at run time.
A sample provider specification for Prometheus is provided here.
It describes the following metrics:
- request-count
- latency-mean
- profit-mean
Launch experiment
iter8 k launch \
--set "tasks={custommetrics,assess}" \
--set custommetrics.templates.model-prometheus="https://gist.githubusercontent.com/kalantar/80c9efc0fd4cc34572d893cc82bdc4d2/raw/f3629aa62cdc9fd7e39ee2b6b113a8bf7b6b4463/model-prometheus-abn-tutorial.tpl" \
--set custommetrics.values.labels.model_name=wisdom \
--set 'custommetrics.versionValues[0].labels.mm_vmodel_id=wisdom-1' \
--set 'custommetrics.versionValues[1].labels.mm_vmodel_id=wisdom-2' \
--set assess.SLOs.upper.model-prometheus/latency-mean=50 \
--set "assess.rewards.max={model-prometheus/profit-mean}" \
--set runner=cronjob \
--set cronjobSchedule="*/1 * * * *"
This experiment executes in a loop, once every minute. It uses the custommetrics task to read metrics from the (mocked) Prometheus provider. Finally, the assess task verifies that the latency-mean is below 50 msec and identifies which version provides the greatest reward; that is, the greatest mean profit.
Inspect experiment report
iter8 k report
The text report looks like this
Experiment summary:
*******************

  Experiment completed: true
  No task failures: true
  Total number of tasks: 2
  Number of completed tasks: 2
  Number of completed loops: 2

Whether or not service level objectives (SLOs) are satisfied:
*************************************************************

  SLO Conditions                      | version 0 | version 1
  --------------                      | --------- | ---------
  model-prometheus/latency-mean <= 50 | true      | true


Latest observed values for metrics:
***********************************

  Metric                        | version 0 | version 1 | Best
  -------                       | -----     | -----     | ----
  model-prometheus/latency-mean | 19.00     | 43.00     | n/a
  model-prometheus/profit-mean  | 71.00     | 92.00     | version 1
iter8 k report -o html > report.html # view in a browser
The HTML report looks like this
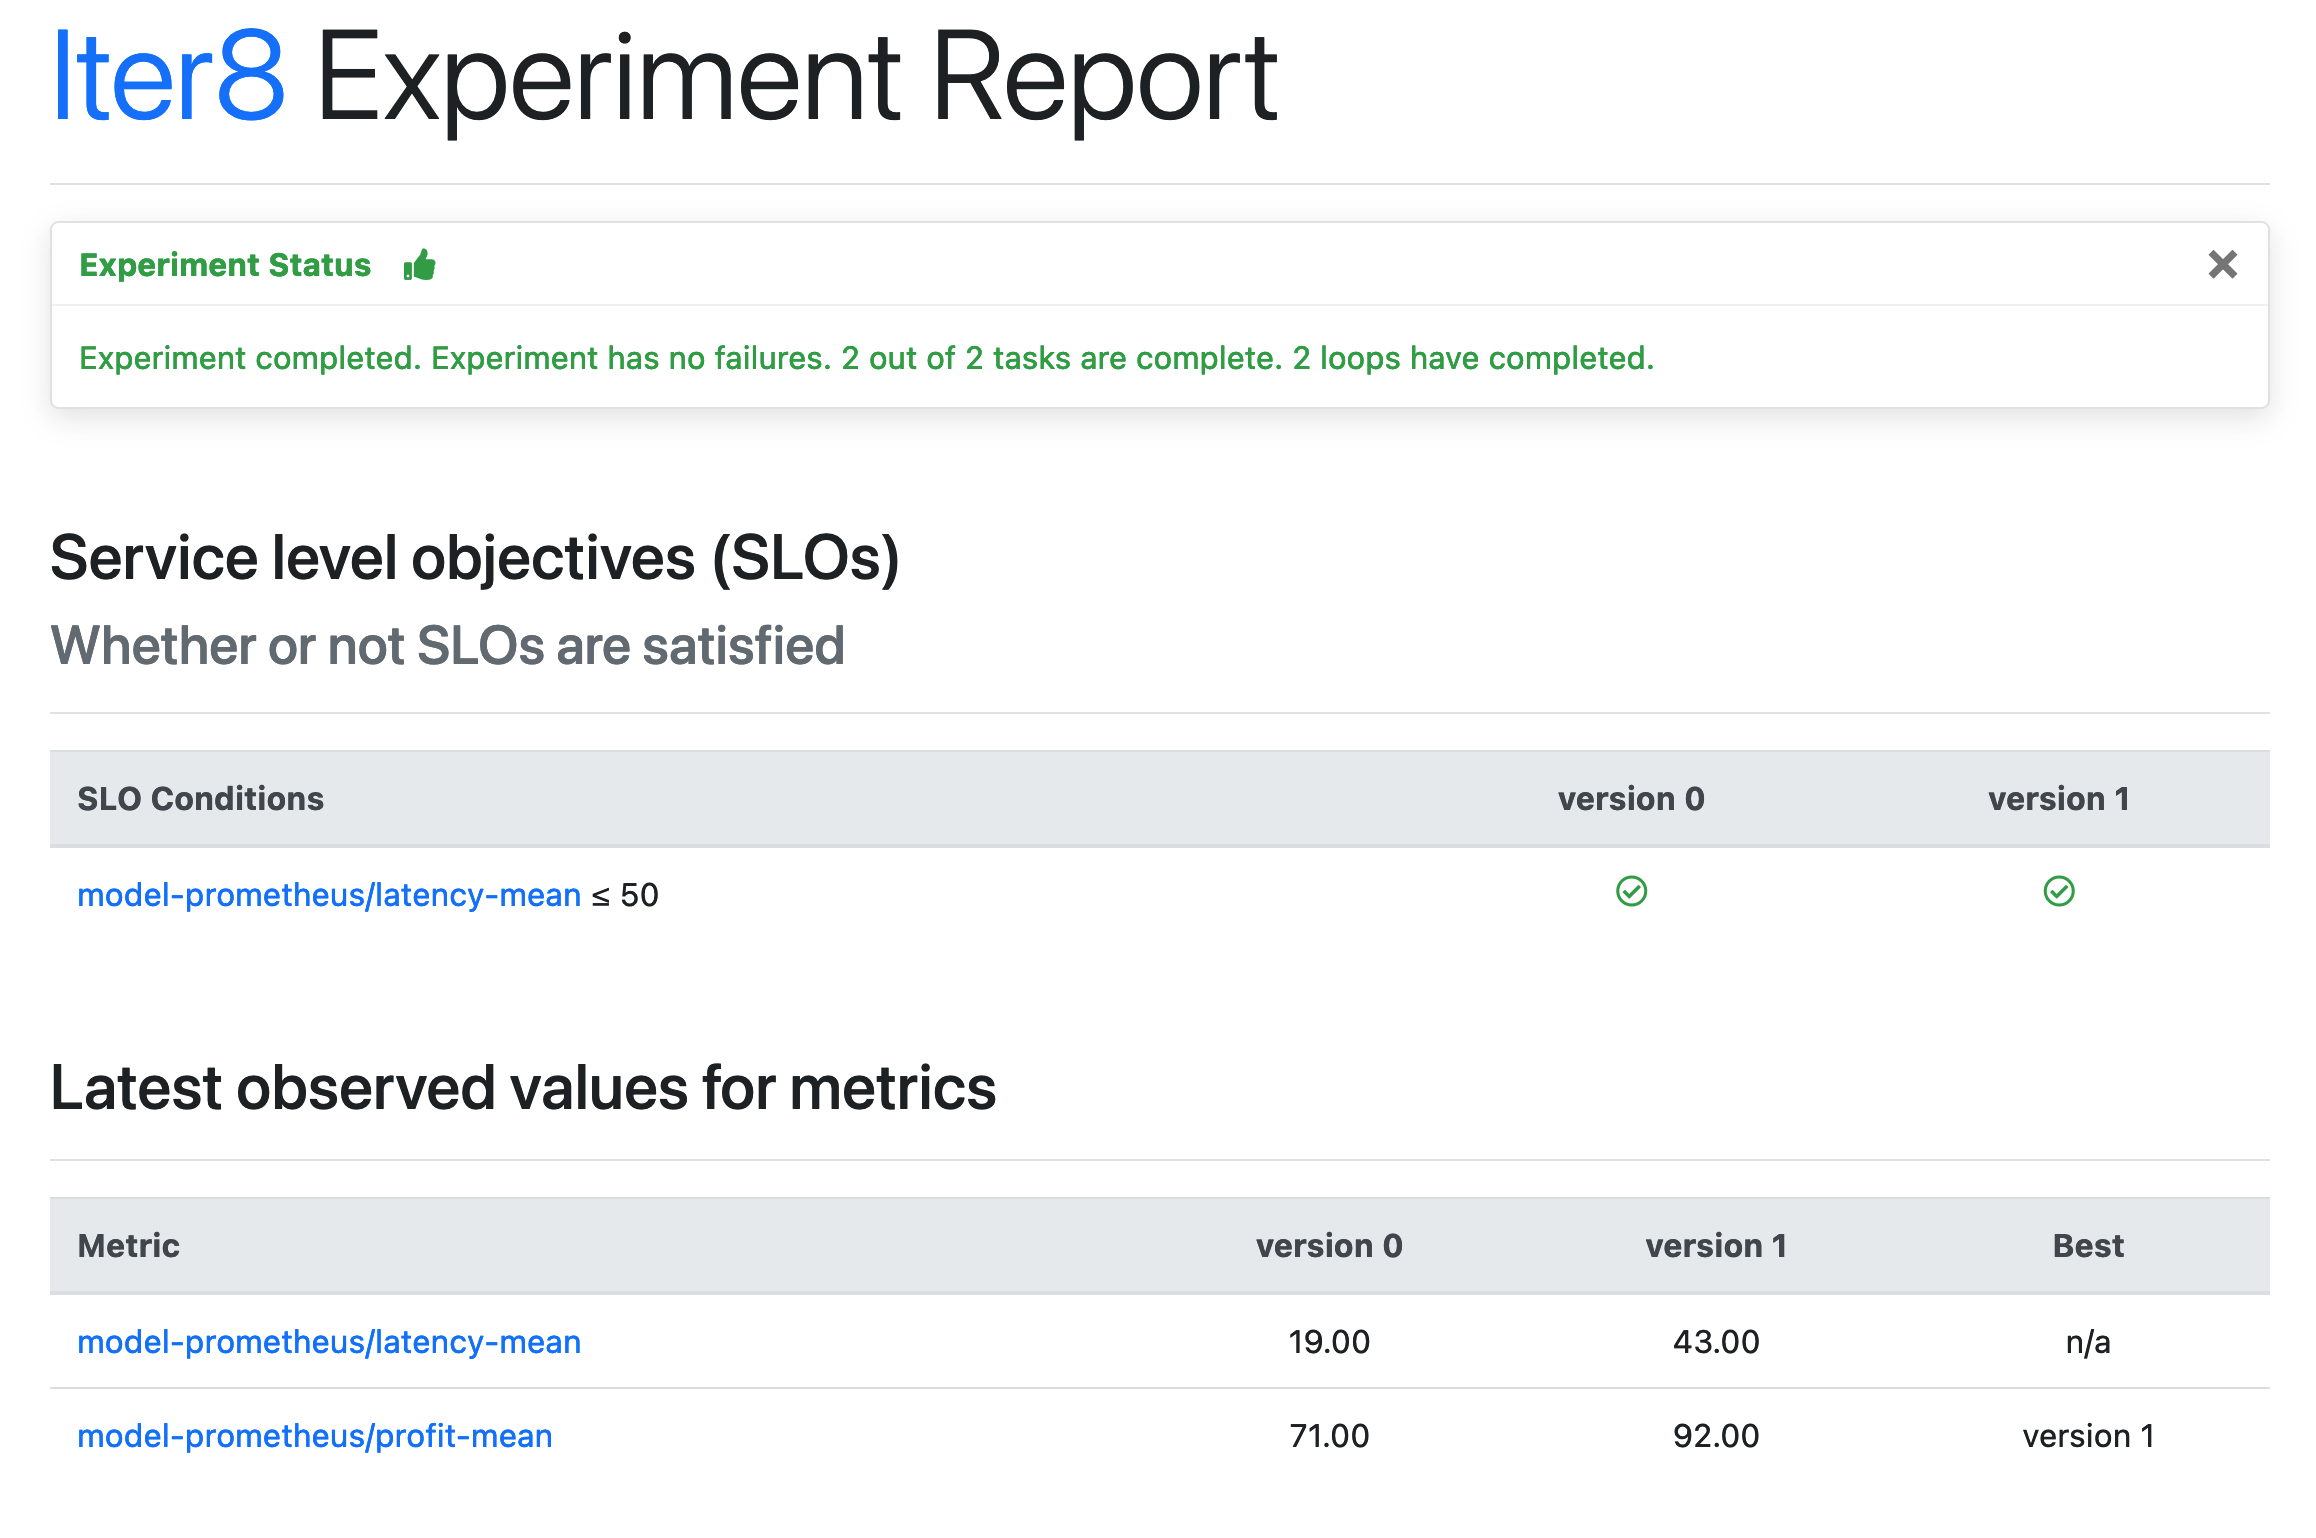
Because the experiment loops, the reported results will change over time.
Cleanup
Delete the experiment:
iter8 k delete
Terminate the mocked Prometheus service:
kubectl delete deploy/prometheus-mock svc/prometheus-mock